Coronavirus modelling at the NIPH
Article
|Last update
|This page briefly describes the model used by the NIPH for situational awareness and forecasting of the coronavirus outbreak in Norway. The reproduction number (R) can be found in the daily reports listed below.
All modelling reports
The NIPH produces both forecasts and scenarios
What is a forecast?
The NIPH's weekly modelling reports contain forecasts which describe the expected disease status three weeks ahead if the current trend remains unchanged.
The forecasts are based on historical data up to the day they are fed into the models so they do not allow for recent changes that are not yet visible in the data. For example, there is a delay between infection and admission to hospital.
Another prerequisite for the forecasts to materialise is that there are no significant changes in the next few weeks in, for example, infection control measures.
Such factors can be:
- That new measures are introduced
- That measures are eased
- That we get a combination of introduction and easing of measures
- That vaccination coverage changes significantly
- That there are no new virus variants with different transmission properties.
We believe that it is not possible to make good long-term forecasts for the COVID-19 pandemic. Therefore, our forecasts are limited to 3 weeks ahead. These are descriptions of the near future that are within reason if the conditions do not change.
What a scenario is – and what it is not
In addition to forecasts for the near future, usually three weeks ahead, we create scenarios. Scenarios are not forecasts of how the Norwegian Institute of Public Health believes the COVID-19 epidemic will develop in the future. Often, the scenarios include a number of assumptions we do not expect to happen. It would therefore be wrong to present a possible scenario from NIPH as a picture of what NIPH believes could happen.
The scenarios are intended as an expression of a situation we may find ourselves in if a number of described assumptions occur. Therefore, several scenarios are created - including a worst case scenario.
The purpose of the scenarios is to give ourselves and others who make decisions and plan for further preparedness, a better understanding of which alternative future situations we should be prepared for. It can therefore be a support for further strategic planning.
Reproduction number (R)
Updates to the reproduction number are also published in the weekly reports.
The model estimates of the reproduction number depend greatly on trends in the number of patients admitted to hospital with a COVID-19 diagnosis in Norway. In addition, the test data are used to obtain the best possible estimates of the infectivity of the virus. The test data are also more up-to-date, and therefore contain more information about any recent changes in the infection situation. The estimates are updated regularly and published in the weekly reports.
A list of earlier reports from the modelling group can be found at the end of this page. In each report you will find R in table 1.
Uncertainty
There is still considerable uncertainty associated with the course of COVID-19 disease and about how many people require hospitalisation and treatment. This has consequences for the model predictions. We handle this uncertainty to some extent with stochastic (random) simulations.
We continuously update the parameters in the model as new knowledge and better data become available. We are constantly working to improve the methods we use to estimate the model parameters from the data. Some of the parameters are based on estimates from the literature, while others are estimated from Norwegian patient data at the individual level.
Meta-population model
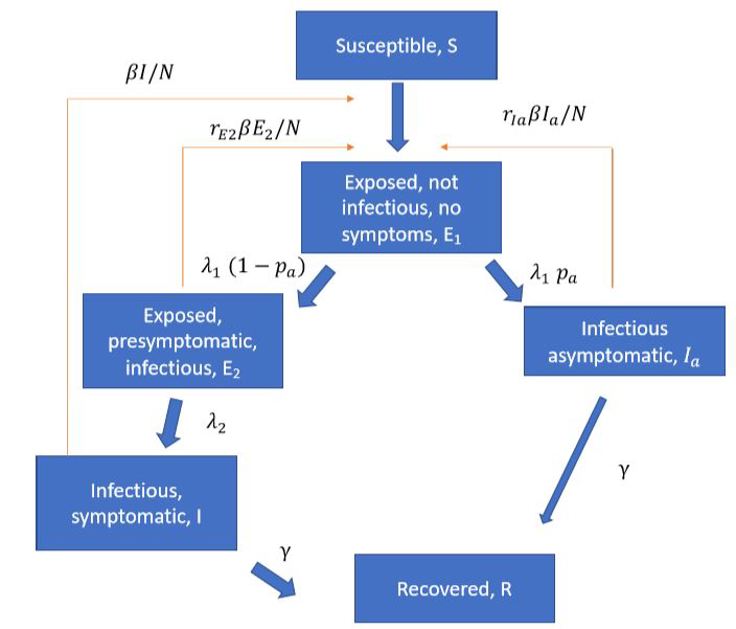
The model is a stochastic SEIR-type model with a local transmission process in each municipality. The spread between municipalities is modelled by following how people travel between municipalities. The amount of travel between the different municipalities is based on mobile phone data from Telenor. The model is a further development of Engebretsen et al. (2019) and Engebretsen et al. (2020).
Several articles (Ferretti et al 2020, ECDC report, LSHTM report) have pointed to the importance of pre-symptomatic infection so we include pre-symptomatic and asymptomatic infection in the model. A schematic overview of the epidemiological model is illustrated below:
The latest reports, with further details of the model, can be found in the list below.

Mobility data from Telenor Norway show how many people have travelled from municipality A to municipality B during each 6-hour intervals every day. We simulate mobility by moving people every 6 hours, according to the mobility data. Between the transfers, we allow everyone to mix for 6 hours, so that the virus can transmit among people in each municipality by contact between infectious individuals and susceptible individuals.
The model implementation is available on GitHub. We use the asymmetric_mobility_se1e2iiar model from this package.
The model gives us time series for the number of individuals in each disease state (the classes in the figure above) in each municipality. We use predicted incidence in each municipality to simulate the number of hospitalisations, intensive care patients and deaths.
Model parameters
For the transmission part of the model, we use data from Ferretti et al. (2020), with some minor changes based on the ECDC report on the pre-symptomatic period.
Parameters | Value |
Exposed period | 3 days |
Pre-symptomatic period | 2 days |
Symptomatic infectious period | 5 days |
Infectiousness pre-symptomatic | 1.25 |
Proportion asymptomatic | 40 % |
Infectiousness asymptomatic | 0.1 |
For the proportion who need hospitalisation, we use age-based rates based on data from Salje et al. (2020) adjusted for the proportion in nursing homes and scaled by 1/3 so that the death rate in Norway is 0.7 per cent per infection.
In addition, we adjust for the age distribution of the infection cases in the population, which we estimate based on test data. These are updated regularly, and we refer to the various reports for updated probabilities. We also correct for reporting delays for the last four days when we calibrate for data. Using historical data sets, we have estimated the probability of reporting delays of 1-4 days, both for hospital admissions, positive tests and negative tests. The estimated probabilities are updated regularly, and we refer to the latest modelling report for updated estimates.
Parameter | Value |
Time spent in hospital | See figure 2 below |
Risk of hospitalisation (total) | 3.9 % |
Hospitalisations per infection 0- 9 years 10-19 years 20- 29 years 30-39 years 40-49 years 50-59 years 60-69 years 70-79 years 80+ years |
0.2 % (Salje et al, 2020) 0.2 % 0.6 % 1.3 % 1.7 % 3.5 % 7.1 % 11.3 %* 27 %* |
Symptom onset to hospitalisation | 9.7 days up to 1 August (neg. binomial) |
Percentage in Intensive care unit: | |
February-July 2020 | 16 % |
August- 2020 | 7.6 % |
* The proportion of hospital admissions is reduced since nursing home residents are not usually admitted. | |
Calibration
One of the key parameters in the model is the reproduction number. We calibrate the model and estimate the reproduction number so that the model is adapted to hospital admissions and testdata on a national level, as well as county level.
In the calibration and simulations, we take into account all confirmed imported cases from abroad. We place them in their residential communities on the date they developed symptoms, in the symptomatic class. Since there are likely to be more imported cases than those confirmed, we include an amplification factor that we also calibrate on the data.
We vary the estimated reproduction number along the way in the model, and define R0 (the reproduction number at the beginning of the model) and Reff1 and Reff2 ... according to implemented measures. We regularly introduce new reproduction numbers, in order to be able to capture recent developments.
We calibrate these together with the amplification factor at sequential ABC, where we compare simulated new hospital admissions with observed new hospital admissions, and the simulated positive test cases with the observed ones.
Uncertainty - results
The results from the model are subject to uncertainty due to randomness in spread and mobility (whether infectious or susceptible people travel, for example) and uncertainty in the estimated parameters. In addition, there are several sources of uncertainty that the model does not capture, as we do not take into account uncertainty associated with the model's other parameters. The model is a simplified representation of reality and is based on an assumption of average behaviour in the population across ages.
The number of patients admitted to hospital is based on the parameters that quantify the proportion of infected patients admitted to hospital. This has major uncertainties and impacts significantly estimates of the number of people who have been infected in Norway. As new knowledge suggests that fewer of those infected need to be admitted to hospital, and as the model is based on the number of hospital admissions in Norway, the estimate for the number of infected in Norway has been adjusted upwards in the model from week 16.
Soon we hope to update more parameters in the model about healthcare sector use to Norwegian conditions using data from the Preparedness register. For better predictions, it will be essential to obtain data from planned prevalence studies. These data can significantly change the estimated proportions in hospital. For the most up-to-date parameter values, we refer to the latest modelling report.
The model does not contain an age structure, and transmission between different age groups is therefore not captured. Advice that the elderly should not have contact with others and thus reduce their risk of infection is, for example, not included in the model.
Interpretation of results
The results of the model should be interpreted with caution and must always be viewed in the context of other information and with epidemiological assessments. As mentioned above, there are many moments of uncertainty and the model is constantly improved.
In the model, hospital data and testdata are used to understand the evolution of the epidemic. If estimates of admissions do not match the model's estimates, it means that the model must be revised to better describe the developments we are observing. If other data are not well described by the model, it probably means that some of the parameters do not describe the situation in Norway well enough. We try to update these parameters as soon as we get updated information.
Modifications to the model
The model is dynamic and we update it when we receive new information from Norway or abroad. Major changes are described in the detailed report.
Other COVID-19 models developed by NIPH
In addition to the metapopulation model we have described above, the NIPH is developing an individual-based COVID-19 model based on a published model in Di Ruscio et al. (2019) that was developed to study the spread of methicillin-resistant S. aureus in Norway. In this model, the spread of infection is simulated in detail and the model can be used to estimate the effect of measures such as closing schools or working from home. This model can also look at effects among different age groups. We have also developed a national age structure model to assess the effects of possible vaccines against COVID-19. In this national model, we use data from the Directorate of Health on risk groups for COVID-19 and the number of healthcare professionals working actively in the healthcare sector for targeted vaccination.


