YoungGrowth: Evaluation of free school fruit on childhood growth and obesity - a natural experiment
Project
|Published
By using data on body mass index (BMI) and waist circumference in 8-year old and 13-year old children, we can estimate the effect of a free fruit program in schools.
Summary
1. Relevance relative to the call for proposals
2. Aspects relating to the research project
Background and status of knowledge
Tackling childhood obesity is one of the largest global public health challenges of present times . Projections indicate dramatic increases in overweight and obesity prevalence worldwide (1, 2). However, recent data from Western populations suggest that upward trends in levels of overweight and obesity may be stabilising (3). It is worth noting that the stabilisation might apply only to BMI based measures of obesity, whereas data suggest continued increases in abdominal adiposity (i.e. waist circumference) indicating ongoing changes in body composition (4-6). Fat distributed more centrally has more serious health consequences. Another aspect is that the stabilisation might apply only to the population mean. The NCG study confirmed previous findings on socio-economic differences in childhood obesity (7), as well as differences between minority groups and the majority population (8, 9). The evidence suggests that these patterns will contribute to further socio-economic- and ethnic health disparities in adulthood.
The World Health Organisation (WHO) has introduced a target to stop the rise in obesity by 2025 (10), and widespread calls have been made for regular monitoring to track childhood obesity trends and potential determinants (11, 12). Substantial evidence supports a link between childhood obesity and cardio-metabolic risk, both in early and later life (13). Childhood obesity often tracks into adulthood (14, 15) and is associated with lower health related quality of life (16) and lower self-esteem across the life course (17). It comes with a considerable economic cost (18, 19). Efforts to intervene on the obesity epidemic certainly should begin early in life (11, 20). There are high priority global-reach initiatives aimed at halting the rise in overweight and obesity in children and young people (21, 22).
In a European context, Norwegian children have a low intake of fruit and vegetables (23). Children from families with high socio-economic position (SEP) have more healthy diets than children from lower positions (24). Schools are one of the most important community settings for promoting healthy lifestyle behaviours among children. It is an environment in which attention and learning are the norm, and schools have the potential of reaching all children regardless of gender, ethnicity and socio-economic background.
Several studies have been conducted in order to prevent excessive weight gain in youth, the current evidence base on prevention of excessive weight gain is very limited (22, 25, 26). The overweight/obesity epidemic is often used as the main argument to support the increasing fruit and vegetable (FV) intake in school children, as indicated by the recent implementation of the EU fruit scheme (27). Theoretically, an inverse link between FV intake and prevalence of overweight and obesity is convincing (28).
Based on the epidemiological literature, however, it is not clear whether a sufficient intake of FV really can help to maintain a healthy weight, and studies assessing the weight impact of successful FV intervention are clearly lacking (29). Ideally, interventions should be done using a randomized, controlled design. This is not always possible, and to broaden the evidence base, evaluation of natural experiments has been suggested (12). In Norway, we now have the possibility to examine the effect of free school fruit on weight development in children.
Approaches, hypotheses and choice of method
By applying a natural experimental approach, we will exploit an existing unique series of datasets from the population based NCG-study. The proposed project is a joint effort of three institutions and is divided into three work packages (see below), each with their own objectives. The work packages combined, will contribute to our understanding of the epidemiology of childhood growth and obesity.
The exposure - the natural experiment
From the fall of 2007 to the spring of 2014 an official free school fruit program, without parental payment, was implemented in all combined elementary and secondary elementary schools (grades 1-10, about 25% of the schools) in Norway, but not in pure elementary schools (grades 1-7, about 75% of the schools). Earlier evaluation of the free school fruit program demonstrated increased fruit intake and reduced intake of unhealthy snacks (30-32), as well as decreased social inequalities in these eating behaviours (30, 32). A potential impact on weight status has also been reported for a pilot version of the program (33). However, there is a clear need for a larger study to estimate the impact of the intervention with: a) sufficient precision and control of confounders, and b) rigorous analytic framework that best exploit the available data and maximises causal inference.
The outcome - the Norwegian Child Growth study (NCG)
The NCG was initiated to systematically monitor height, weight and waist circumference among 3rd graders (~8-year-olds), thus forming nationwide and nationally representative samples . The intention was to detect changes in weight development in Norwegian children. The high participation rate (90%) and few missing values provide a unique strength to the study (34). The NCG followed the protocol from the WHO European Childhood Obesity Surveillance Initiative (COSI) (35, 36). Measurements were performed by school-health nurses.
Cross-sectional data
Longitudinal data
Thus, for the surveys in 2010 (children born 2002) and 2015 (born 2007), we have collected heights and weights of children from the MBRN and from health records kept in as measurements in health clinics and school health services. Routine measurements in Norway are scheduled at birth and at the age of 6 weeks, 3, 6, 9, 12, 15, 18 and 24 months, and 3, 4 and 6 years.
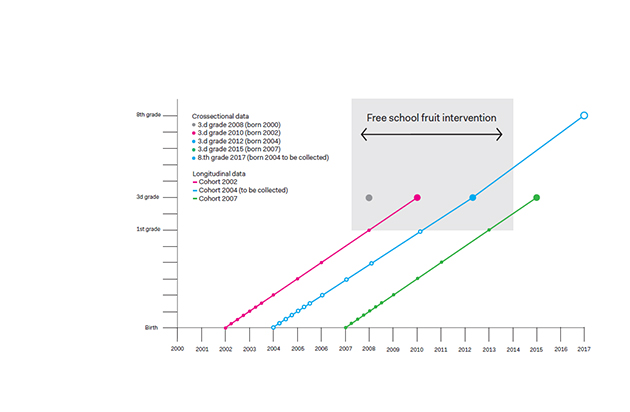
The longitudinal data for the 2012 survey (children born 2004) will be collected as part of this project, from birth onward. In addition, we will measure height and weight from these children in 2017, when they will be 8th graders (~13-year-olds), as depicted in figure 1, according to the same protocol as in previous data collections. Over time, the NCG has gained high acceptance in the school-health service. Similar to 3rd graders, 8th graders (13 year olds) are also routinely measured in the school-health service. We therefore expect the participation rate to remain high and estimate the study sample of 3000. The follow-up will provide objectively measured longitudinal anthropometric data from birth to 13 years of age, and historical cohort data for children born in 2002, 2004 and 2007. This is a unique collection of cohorts for examining questions pertaining to childhood growth and obesity. Figure 1 shows the time points of measurements of children's height, weight and waist circumference (in 8th grade only height and weight) that are available and will be used in this project. The blue, open dots illustrate data to be collected within this project. The grey area illustrates the time period covered by the Norwegian free school fruit implementation.
Objectives
- To estimate the effect of the free school fruit program on childhood growth and obesity.
- Secondary objectives:
- To describe childhood growth in these cohorts, and provide an analytical framework that will support the research questions in this proposal and maximise the potential for causal inference.
- To describe recent secular trends in childhood overweight/obesity and body composition and its patterning by gender, geographical, socio-economic and ethnic factors.
- To estimate differences in the effect of the free fruit program on childhood growth and over-weight/obesity according to gender, geographical, socio-economic and ethnic factors.
- WPI Design a statistical and methodological framework
- WPII Describe trends, body composition, social inequalities and determinants
- WPIII Evaluate the effect of free school fruit on child growth and social inequalities
Work package I – Design a statistical and methodological framework
Conditional growth approaches (37, 38), linear (39) and non-linear multilevel models (40), and latent class growth models (41) can each capture and describe different elements of growth. Since the natural experiment is not designed as a randomised trial, we need to have as much control as possible for potential confounding factors that might explain differences between children attending intervention (free fruit) and control (no free fruit) schools. Several growth modelling approaches and approaches to control for confounding will therefore be investigated. In WPI, we will thus develop growth models that describe childhood growth and set up analyses to address the applied research questions in WPII and III, paying close attention to strengthening causal inference. Figure 2 shows a conceptual map of this WP and how it supports the other packages.
An issue common to all growth analyses is data quality. The probability of an error per individual is higher with longitudinal data because of multiple observations per person. Harmonising data quality across cohorts may therefore help reduce bias and improve power. We will adapt an approach for identifying suspicious observations (42) using both the longitudinal and cross sectional data structure, (see [A] figure 2).
Lastly we will design an analytical strategy that seeks to strengthen causal inference in the evaluation of the school fruit natural experiment (see [C] figure 2). The biggest threat to causal inference is likely to be unwanted sources of observed and unobserved variation in the exposure groups, caused by non-random allocation of the intervention.
We will consider both standard regression approaches and propensity score matching as means of controlling for observed sources. The availability of longitudinal data before and after the intervention, and cohorts that have been exposed to the intervention for different lengths of time, may also help us learn about the effect of unobserved sources of variation (44).
If the intervention is having a causal effect then we may expect to see this by comparing the growth patterns before and after the intervention in both groups, assuming that both groups would respond in a similar way in the presence or absence of the intervention. Growth mixture models and conditional growth analysis, which can offer a degree of control for growth before the intervention, may help us explore this further and will be investigated.
Additionally, we can compare cohorts that received the intervention for the same length of time, and compare cohorts that have received the intervention for different lengths of time, to see if the results are consistent. Regardless, by developing a strategy that combines multiple methods we will be able to draw more robust conclusions concerning the effects of the school-based fruit intervention.

Figure 2. Conceptual map of WPI and its integration with the objectives in each of the other WPs.
The specific objectives in WPI are:
- To estimate a range of growth models that describe the growth of Norwegian children.
- To produce an analytical and methodological design that will support the research questions asked in WPII and WPIII and maximise causal inference.
Work package II – Describe trends, body composition, social inequalities and determinants
The aim of WPII is to investigate trends in childhood adiposity; patterns of body composition (differentiating between general overweigh/obesity; based on height- and weight measurement, and abdominal obesity; based on waist circumference measurements), socio-economic inequalities and potential determinants. Societal changes have influenced the lifestyle and the prevalence of adiposity among children and adults worldwide in recent decades. There has been awareness of socio-economic differences in childhood obesity for decades, but little is known of recent trends and how they are related to potential changes of body composition. Our standardised data enable us to investigate these trends, with a focus on inequalities and body composition and hence any changes over time. It will also provide important insights into how these patterns vary by gender, geographical area, parental socio-economic position, marital status and ethnicity (7-9). The models developed in WPI will be used. Describing these patterns will inform public health authorities about the extent and direction of inequalities in growth and obesity.
An association between socio-economic background and height has consistently been reported. Mothers from high socio-economic position give birth to taller children (45). Height differences have been suggested to be lessening the last generations (46). However, there are indications that increasing socio-economic differences in height have reappeared (47). Increased social inequalities in overweight and obesity in the UK from middle 1970s to the 1990s were perhaps due to relative limitation of height growth. Corresponding socio-economic differences in weight over time were not found (48). The suggested explanation of relative limitation in height growth was increased intake of processed food and easy available energy- and low-nutrient-dense food from the 1970s onward in lower socio-economic groups. We do not know whether similar changes may contribute to social inequalities in height growth among Norwegian children.
- To investigate and describe trends of general- and abdominal obesity and investigate whether pattern of body composition has changed among Norwegian children from 2008 to 2015.
- To estimate differences in obesity between groups, according to parental socio-economic position, ethnicity and geographical location.
- To investigate to what extent socio-economic differences in childhood obesity in Norway can be explained by height growth.
Work package III - Evaluate the effect of intervention; a natural experiment
Within the NCG, the children (at 1-10 grade schools = intervention schools, but not 1-7 grade schools = control schools) have received different exposure to the free school fruit program. At the age of 8 years (in the third grade), the children in the intervention schools have received one, two or three years of free school fruit (figure 1). The follow-up study of children in the 8th grade in 2017, will provide the opportunity to evaluate the effect of 5 years (elementary school years 1-5, see figure 1) of free school fruit. Baseline measures will be available from birth to 6 years of age for three of the cohorts within the NCG study.
The main objective of this part of the project is therefore to evaluate the effect of free school fruit on weight status. The models developed in WPI will be used and extended to examine whether growth patterning differs between the 1-10 schools (free fruit intervention) and the 1-7 schools (controls). Secondary objectives are to assess if this potential effect varies according to genders and geographical areas in addition to parental socio-economic position and ethnicity. This makes the current project unique in evaluating of the effect of a free school fruit programme, an effort possible for governments to implement.
- To estimate the effect of 5 years of free school fruit on weight status and waist circumference, as well as on development in growth patterns as described in WPI
- To estimate if this effect might be different for different groups. For instance, is the effect of the free school fruit programme different according to gender, parental socio-economic position, ethnicity and geographical location.
- To estimate the difference in effect between one, two and three years of free school fruit.
3. The project plan, project management, organisation and cooperation
As the project brings together a multidisciplinary team in order to accomplish a challenging work program within three years, a clear and effective management structure is important. This is shown schematically in figure 3.
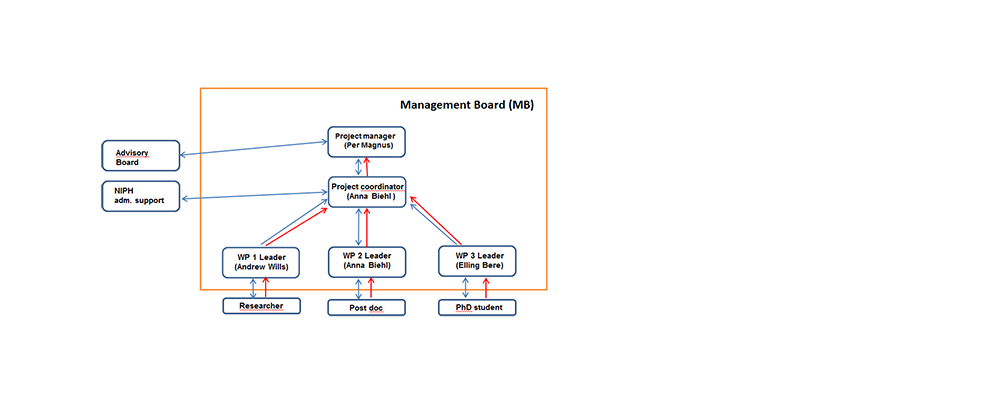
Figure 3. Management Structure
The Management board (MB) will have the general responsibility for the project’s planning and development. The MB will be based at the NIPH and composed as showed in figure 3. The flow of communication (blue) and responsibility (red) is shown with the direction of arrows. The project will have regular meetings (1-2 per year) for control of advancement of the project. NIPH offers administrative support to coordinators of projects that NIPH is the host institution for. Project progress will be monitored according to the projected time plan showed in the Gantt chart, figure 4.
- Project leader Per Magnus, professor, MD, PhD has a background in medical genetics and epidemiology, in particular perinatal and childhood epidemiology. He has been the principal investigator (PI) of the Norwegian Mother and Child Cohort Study (MoBa) since 1998, and has served as PI on a large number of research projects. He is an experienced researcher within paediatrics; perinatal health and childhood disease. Magnus will be responsible for the overall management and dissemination of results.
- Andrew Wills, PhD, WPI leader, is a lecturer in applied statistics at the University of Bristol (UoB). He has extensive experience and knowledge of the statistical methods in this proposal as evidenced by peer-reviewed publications, a book chapter and his own teaching workshops. He will supervise the researcher at UoB.
- Anna Biehl, WPII leader, will coordinate the project. Biehl has worked as advisor in the NCG since 2008 and has in-depth knowledge of the study, findings and the entire organisational apparatus. Her PhD (dissertation 2014) was based on NCG data.
- Elling Bere, WPIII leader, is professor at the University of Agder (UiA), Public Health Science, and has specific competence in evaluating intervention studies. Bere has experience in leading intervention studies, for instance the RCN funded FVMM project and EU funded ENERGY project. The present project fits with the profile of the research focus at UiA, and there is also a relevant PhD program within the faculty. Bere, together with Tonje H Stea (see below) will supervise the PhD student together.
Advisory board will have complementary competence within biostatistics, general epidemiology, social epidemiology, medicine and nutrition.
- Bjørn Heine Strand, PhD, biostatistician and epidemiologist at the NIPH, is a specialist in social epidemiology and in the analysis of epidemiological data. Strand has been an analyst and provided epidemiological support to the NCG-study since the study started.
- Tonje H Stea is an associate professor in Public Health Science at UiA, and has been heavily involved in several studies focusing on mapping and improving healthy lifestyle habits in children and young people. Currently, she is the project leader in the RCN’s funded project: A controlled family based trial: the effect of a lifestyle intervention targeting overweight/obese children.
- Professor Bianca De Stavola and Dr Richard Silverwood are Co-directors of the Centre for Statistical Methodology at London School of Hygiene and Tropical Medicine. Both have made substantial contributions to the methodology that will be applied in this project. They will provide specialist statistical and methodological expertise and oversight for WPI and for the project generally.
This project is an important step towards developing and establishing an environment for obesity research at the NIPH. It will compliment and be strengthened by close knowledge exchange and cooperation with the burden of obesity project (PI Jonas Kinge) at NIPH, which focuses on the consequences of obesity for morbidity, mortality, health service use and the labour market.
Interdisciplinary and cross-sectoral cooperation
This project will further interdisciplinary and cross-sectorial cooperation by involving specialists from the fields of nutrition, statistics and epidemiology from universities in both Norway (eg. Knut-Inge Klepp and the Department of Nutrition at the University of Oslo) and the UK (eg, Andrew Wills, leader WPI, is based within the Bristol Biomedical Research Unit for Lifestyle and Nutrition which has research themes and expertise with common interests, these will be exploited), and from the governmental research and advisory sector. This cooperation is vital for the success of the project, and will also be of great value in the different research approaches the participants bring to the table.
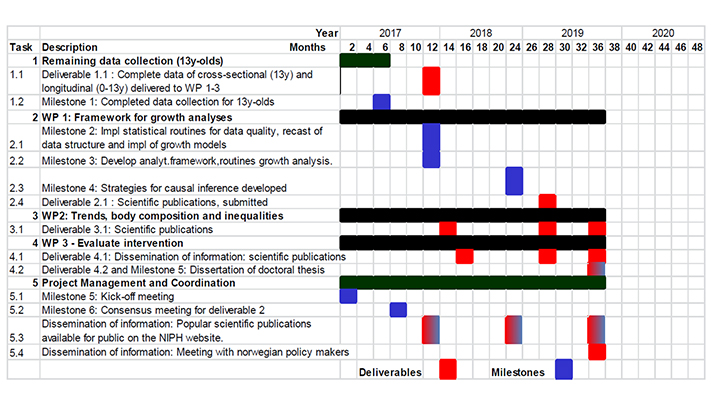 Figure 4. Gantt Chart - project implementation plan.
4. Key perspectives and compliance with strategic documents
Relevance and benefit to society
Ethics and approvals
Gender issues
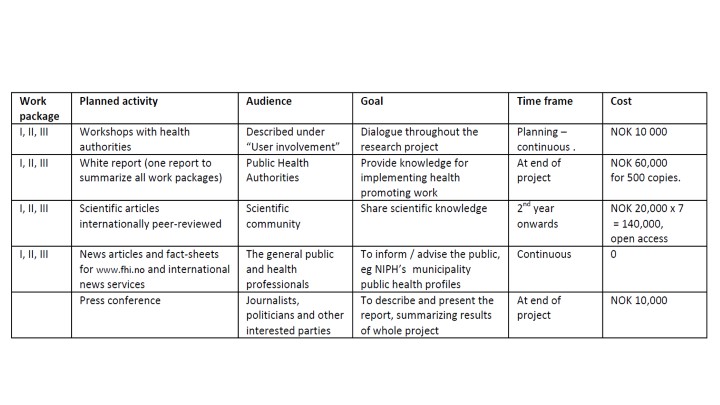
5. Dissemination and communication of results
6. Additional information specifically requested in the call for proposal
User involvement
Anticipated benefits
Project number
260408
Start
2017
End
2020
Status
Active
Financing
The Research Council of Norway
