CO-CREATE is working with youth to map out the societal obstacles for leading healthy lives
News
|Published
Choosing the healthy path in a society of abundance is challenging in any age group, resulting in epidemic levels of overweight and obesity. The EU-funded project CO-CREATE is working with youth in six countries world wide to identify the particular challenges faced by young people, taking a systems approach to the obesity epidemic.
This news article is older than 30 days and the information may be outdated
Go to the home pageObesity: a systems approach
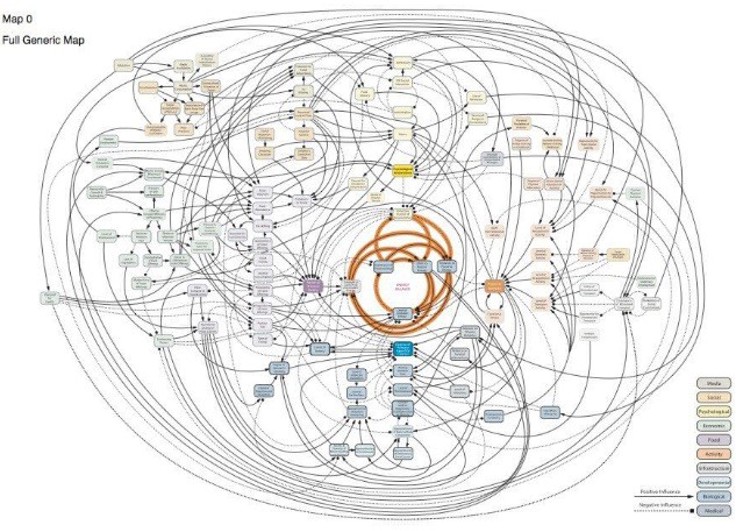
For over a decade now, obesity has been formally framed as a ‘complex system’ problem: the ‘Foresight Report’, depicted obesity as a product of multiple interacting influences, many of which lie outside the control of individuals. While the resulting ‘obesity map’ (Figure 1) has been criticized for being more akin to an indigestible bowl of spaghetti, the theory behind such a framework has much to offer when working on complex social challenges. It is for that very reason that complex systems thinking is the foundation of Co-Create.

Figure 1: Foresight Obesity System Map (high resolution image)
A complex systems approach accounts for the ways different elements of a ‘system’ are interlinked, and how systems are inherently dynamic and uncertain: changes and responses to interventions within the system may emerge randomly and in a non-linear fashion, over an uncertain time-frame. In a complex system, the interventions with the greatest population impact and those that are less likely to entrench health inequalities mostly take place ‘upstream’, using processes that do not require ‘high-agency’ responses from individuals.
An example of ‘linear’ policy making that is also ‘high-agency’ i.e. that requires more effort on the part of individuals, is putting calorie labelling on foods to encourage people to optimise calorie intake for their body weight. As an isolated policy, its logic falls down on many fronts. See Figure 2 which shows the linear policy flow idea in green. Other factors that may directly interrupt that logic are shown in red. Not only would a person have to have an interest or priority in how many calories they are eating, but also, they would have to know how to use the calorie labels. Additionally, many other factors come into play in choosing food beyond calories or health – what about the cost, the taste, the convenience of other foods; while broader factors (in blue) influence food choice too, such as how stressed you feel, how much money you have. The linear logic may also be interrupted by actions that food manufacturers may take such as reformulating foods to lower the calories but not necessarily make them healthier or promoting higher calorie foods. Not to mention the anecdote about the group of teenagers who deliberately competed with their friends to see who could eat the most calories at the burger joint!

Figure 2: Calorie labelling on foods: factors that influence food intake (green = linear policy; red = factors that may interrupt policy logic; blue = broader influences)
Using systems thinking for policy, rather than this linear approach is to consider these other factors and look at the process – such as calorie labelling – in synergy rather than in isolation. For these reasons, Co-Create adopted a systems approach to tackling adolescent obesity, looking at the bigger picture to deliberately explore the complex, ‘messy’ influences on diet and physical activity that must be considered to generate effective public health and other policies.
Systems mapping: a tool for systems thinking
In Co-Create, we are approaching adolescent obesity using a complex systems approach in its various forms– from the mental model we as researchers use to think about the determinants of obesity and the challenge of reducing its prevalence, to formal computational methods that model the potential outcomes of interventions and policies. Along that spectrum, lies ‘system mapping’ – a process that helps to illustrate the extent of the different stakeholders and components involved, and most importantly, the ways they influence one another.
Systems mapping is a visual way of depicting any given system, demonstrating how the different parts of the system relate to one another and interact in a causal manner. Systems mapping is a useful way of depicting not just the components of the system but also some of the features of complex systems, such as the linkages and feedback loops. The map is a tool to clarify and help generate hypotheses about the connections between the various contributing factors, and thereby, to identify potential points in the system to intervene with policies.
A commonly used type of system map is a ‘causal loop diagram’ (CLD) which illustrates the factors in a given system as variables that are linked through cause and effect. It is therefore an ideal way of representing adolescent obesity, with the complexities it entails. That said, it is important to remember that “the map is not the territory” – it serves as a template that can be at once universal and specific, taking account of different contexts across the globe. Additionally, any system map is not a definitive, final depiction of the problem, rather a representation of a consensus of its components and boundaries, by those who generated the map.
Purpose of mapping in Co-Create
An underlying principle of the project is – as its name suggests – to work with adolescents to co-create a representation of the drivers of obesity and policies to reduce levels of obesity in young people across Europe. As a very inclusive, accessible process, system mapping provides an ideal way of beginning this process. The core research in this segment of Co-Create (Work Package 4, or WP4) is to run four mapping sessions with young people in each of the five collaborating European countries (Norway, Netherlands, Poland, Portugal and the UK) as well as South Africa.
Using a particular form of system mapping called ‘group model building’ (GMB) we are working with 16-18-year olds from schools and colleges across a range of socio-economic backgrounds. In groups of about 15 people, we are creating CLDs of what the adolescents perceive to influence diet and physical activity. One of the benefits of GMB as a method is that it shows the ‘system’ or environment within which eating and exercise take place, rather than focusing on each individual’s behaviour. As such, participation is anonymous – we are not asking about the personal experiences of the participants, but what they see as the general influences on diet and exercise. This means that they may express themselves more freely, especially on a potentially sensitive topic such as body weight. Once each group has created the CLD, they are guided through a process to explore places in the diagram where feasible actions could change the factors that affect diet and physical activity for the better.
In addition to the mapping sessions with adolescents, we will be running two others: one with delegates at the European Congress on Obesity and another with European policy-makers.
Within Co-Create, a key purpose for producing the obesity system maps is for use in subsequent Work Packages (see Figure 3). The WP4 CLDs and accompanying “action ideas” generated by participants will be used as the basis for developing policy ideas in the WP5 youth alliances; these ideas will then be discussed with stakeholders in WP6 dialog fora. The CLDs will also feed into WP7, where ‘system dynamics models’ will inform computer simulations to evaluate possible outcomes of co-created obesity policies.

Figure 3: WP4 flow through Co-Create
Co-Create obesity system mapping – where are we now?
All countries participating in WP4 (Norway, Poland, Portugal, Netherlands, UK, South Africa) are conducting the fieldwork for WP4 until the end of May 2019. Recruitment and mapping are underway; here is an update from some of the participating countries.
UK
We have completed GMB sessions in two schools (see Figure 4 for one of their CLDs). Twenty-two students took part in the first school in Hove, over two sessions, and 12 in the second, in one session, in London. One more school has been scheduled to participate in May and we are in talks to recruit a final school.

Figure 4: Causal loop diagram generated by Co-Create participants - perceived determinants of obesity in adolescents
Portugal
Four secondary schools have confirmed their participation, with 15 students in each school. Each GMB process will be conducted over three, one-hour sessions and have already been scheduled in two of the schools.
Poland
Two schools, both in rural-urban areas of lower income/SES (towns of: Swidnica and Miejska Gorka), have signed up to participate in GMB. Another two schools are currently in discussion about participating.
Next update
In the next newsletter we’ll report on the Co-Create mapping sessions with young people in all six participating countries and at the European Congress on Obesity – how they went, and what we have found so far.
About this page
Authors: Natalie Savona, Cécile Knai, Talia Macauley
References
Adams, J., Mytton, O., White, M., & Monsivais, P. (2016). Why Are Some Population Interventions for Diet and Obesity More Equitable and Effective Than Others? The Role of Individual Agency. PLoS Medicine, 13(4), 1–7. https://doi.org/10.1371/journal.pmed.1001990
Allender, S., Owen, B., Kuhlberg, J., Lowe, J., Nagorcka-Smith, P., Whelan, J., & Bell, C. (2015). A community based systems diagram of obesity causes. PLoS ONE, 10(7). https://doi.org/10.1371/journal.pone.0129683
Butland, B. (2007). Tackling obesities: future choices. Project report (2nd ed.). Government Office for Science, London: Dept. of Innovation Universities and Skills. Retrieved from http://bis.gov.uk/assets/foresight/docs/obesity/obesity_final_part1.pdf
Capewell, S., & Capewell, A. (2017). An effectiveness hierarchy of preventive interventions: neglected paradigm or self-evident truth? Review of Economic Studies, (September), 1–9. https://doi.org/10.1093/restud/rdx027
Finegood, D. (2011). The Complex Systems Science of Obesity. The Oxford Handbook of the Social Science of Obesity, 208–236.
Johnston, L. M., Matteson, C. L., & Finegood, D. T. (2014). Systems science and obesity policy: a novel framework for analyzing and rethinking population-level planning. American Journal of Public Health, 104(7), 1270–8. https://doi.org/10.2105/AJPH.2014.301884
Rutter, H., Savona, N., Glonti, K., Bibby, J., Cummins, S., Finegood, D. T., … White, M. (2017). The need for a complex systems model of evidence for public health. The Lancet, 6736(17), 9–11. https://doi.org/10.1016/S0140-6736(17)31267-9
 | This project has received funding from the European Union's Horizon 2020 research and innovation programme (Work Programme 2016-2017: Food security, sustainable agriculture and forestry, marine and maritime and inland water research and the bioeconomy) under grant agreement No 774210 |


