Tobacco use among adolescents (Indicator 9)
Updated
The indicator describes the following: The proportion of adolescents using tobacco.
This indicator is part of Target (5): 30 per cent reduction in tobacco use.
The indicator covers current daily or non-daily use of tobacco. Tobacco use mainly consists of smoking and the use of snus. We present data on the proportion of adolescents who smoke and the proportion who use snus or smoke.
Results
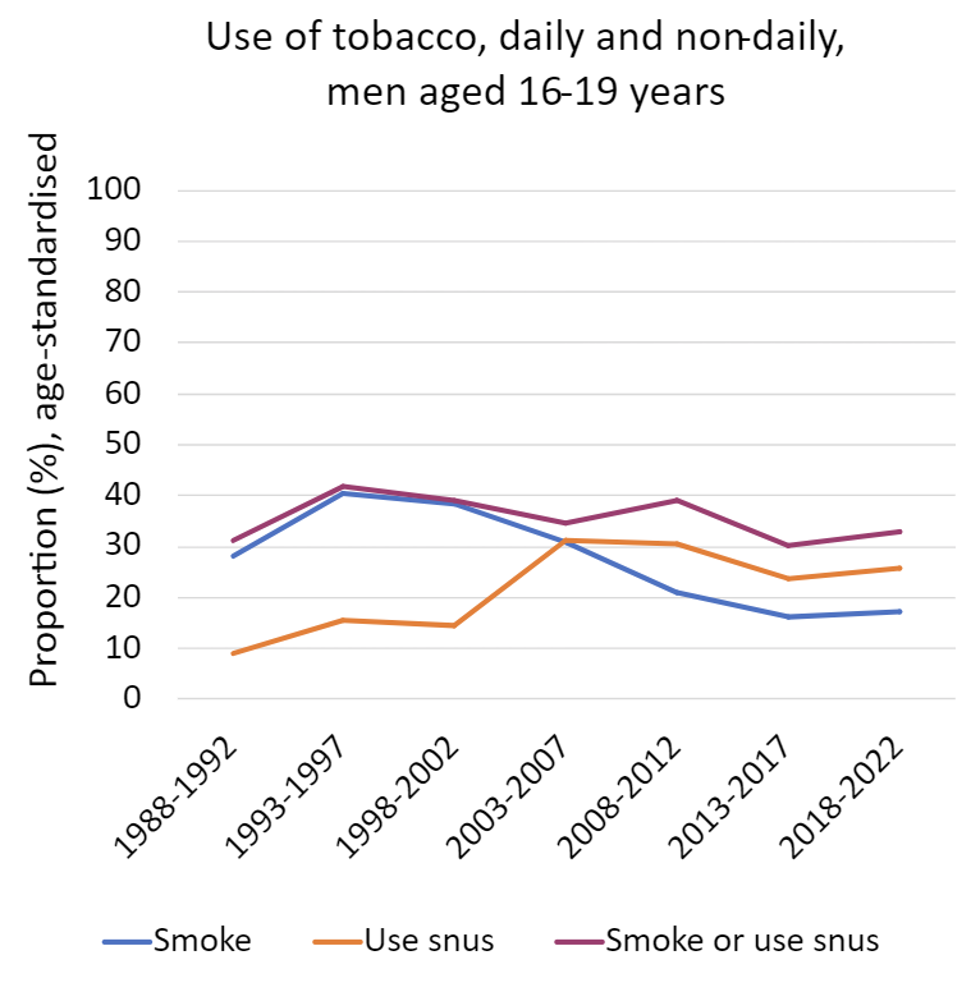
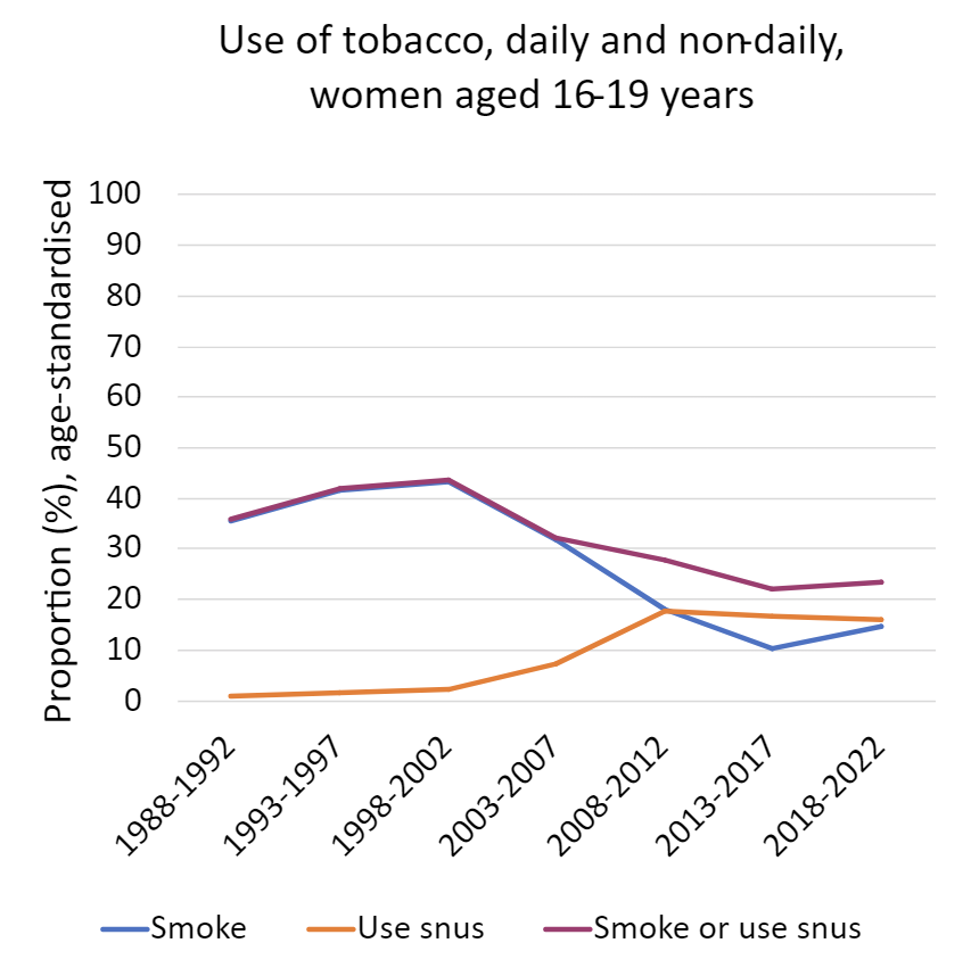
From 1988 until 2022, smoking (daily or non-daily) fell from just under 30 per cent to 17 per cent among men, and from 36 cent to 15 per cent among women in the 16-19 age group. For both genders, there was a period from 1990 to 2000 during which the decline halted.
The decline in smoking coincides with a rise in the use of snus among both genders. However, the increase in regular use of snus stopped around 2010 among young women and since then, there has been a small, but insignificant decrease from 18 to 16 per cent. Among young men, the proportion of daily snus users declined from 2008 to 2022, from 30 to 26 per cent. Despite the rise in the use of snus, there has been a net decline in the total proportion of individuals who responded that they smoked or used snus from the millennium to 2022.

Table for figure 1:
| Year |
Smoke |
Use snus |
Smoke or use snus |
|
1988-1992 |
28 |
9 |
31 |
|
1993-1997 |
40 |
16 |
42 |
|
1998-2002 |
38 |
14 |
39 |
|
2003-2007 |
31 |
31 |
34 |
|
2008-2012 |
21 |
30 |
39 |
|
2013-2017 |
16 |
24 |
30 |
|
2018-2022 |
17 |
26 |
33 |

Table for figure 2:
| Year |
Smoke |
Use snus |
Smoke or use snus |
|
1988-1992 |
36 |
1 |
36 |
|
1993-1997 |
42 |
1 |
42 |
|
1998-2002 |
43 |
2 |
43 |
|
2003-2007 |
32 |
7 |
32 |
|
2008-2012 |
18 |
18 |
28 |
|
2013-2017 |
10 |
17 |
22 |
|
2018-2022 |
15 |
16 |
23 |
Data source: Norwegian Survey of Smoking Habits
The data source for this indicator is the Norwegian Survey of Smoking Habits.
A description and definitions follow below.
Description
The Norwegian Survey of Smoking Habits is a telephone-based, nationwide survey of tobacco use (questions about smoking and snus) among individuals aged 16-79, and undertaken by Statistics Norway on behalf of the Norwegian Institute of Public Health. The survey has been conducted annually since 1973 and the response rate has been around 60 per cent in recent years, around 70 per cent in the 1990s and around 90 per cent in the 1970s. From and including 1985, questions about snus have also been asked.
From 1973 until 1991 the survey was conducted as a supplementary part of the Labour Force Survey. During this period, around 2500 people participated annually. From 1992 until 2016, the survey formed part of Statistics Norway’s Omnibus Survey and Travel Survey. During this period, 2000 people were invited to participate each quarter, with the exception of the second and last quarter of 2015 when 3000 people were invited. The survey was not conducted from the first and third quarter of 1992, the first to the third quarter of 1994, in the third quarter of 1998 and the second quarter of 2000.
Links:
- Web report: Tobacco in Norway (in Norwegian)
- Norwegian Survey of Alcohol, Tobacco and Drugs 2019 (in Norwegian)
- Norwegian survey of smoking habits (Travel survey)
Numerator
- The proportion of adolescents in the 16-19 age range who responded that they smoke and/or use snus on a daily or non-daily basis, stated as a percentage.
Years are stated in five-year groups (1987-1991, 1992-1997, … 2017-2021)
In calculating the figures, changes in the age distribution of the population over time are taken into account in that the figures are standardised to the age distribution of the corresponding population of Norway as of 1 January 2012.
Interpretation and sources of error
Combining daily use and non-daily use entails different consequences for different groups. For young men, non-daily smoking and non-daily snus use have remained relatively stable over time. For women, non-daily smoking is declining over time, while non-daily use of snus is increasing. The result is that there is less of a decline in smoking among women and the use of snus is increasing more over time when we look at regular use compared with daily use.
Data quality
The quality of the data are deemed to be good, although the response rate has declined over time. In recent years, Statistics Norway has calculated weightings to adjust for deviations from the sample. The use of weightings in the generation of tables has very little effect on the results. However, the sample size will be too small to provide useful responses to questions requiring the sample to be broken down into smaller parts, for example one-year age groups or counties.
Global indicator definition
Indicator 10. Prevalence of current tobacco use among adolescents.