Air pollution in Norway
Updated
|Air pollution due to particulate matter (PM), nitrogen dioxide and ozone is a major cause of health problems and disease worldwide. Air quality criteria and measures to reduce road traffic and wood burning are needed to help reduce air pollution levels in Norway.
Main points
- Air pollution levels in Norway have been relatively stable over the last decade. For particulate matter, there has been a slight decline.
- Air pollution levels are similar to the other Scandinavian countries, but lower than in southern Europe.
- Air pollution causes respiratory diseases and deterioration of cardiovascular diseases.
- Many pollutants trigger similar health effects, often in combination.
- In order to reduce air pollution, it is important to have the latest knowledge, to set criteria and introduce measures against traffic and wood-burning.
About air pollution
Air pollution consists of a range of different substances, depending on the source:
- particulate matter
- nitrogen dioxide (NO2)
- ground level ozone
- sulphur dioxide (SO2)
- carbon monoxide (CO)
- metals such as aluminium, arsenic, lead, iron, cadmium, copper, chromium, manganese, nickel, zinc and vanadium are found in the air bound to particulate matter
- polycyclic aromatic hydrocarbons (PAHs) and other organic compounds formed by incomplete combustion
- volatile organic compounds (VOC)
In this chapter we will discuss particulate matter, nitrogen dioxide and ozone. These are considered to be the most important air polluting components that cause problems, disease and death in this part of the world.
Air pollution in Norway today
Regulations for air pollution
We have different values to describe air pollution levels in Norway.
- For air quality criteria, defined by the Norwegian Institute of Public Health and the Norwegian Environment Agency, only unwanted health effects are considered. The criteria are set so that most of the population are protected against harmful effects if they are upheld.
- National goals are health-based and set a long-term national ambition level for local air quality. These goals are new and are set to the same level as air quality criteria for particulate matter (annual mean).
- Limit values are based on pollution regulations. In addition to health, economic and practical considerations are taken into account. Limit values have been revised and are lower for PM10 og PM2.5.
Figures 1A-B, 2A-B and 3 show the levels of particulate matter (PM2.5 and PM10), nitrogen dioxide (NO2), and ozone in recent years (2003–2015) in the most polluted towns in Norway.
Particulate matter
Road traffic usually contributes most to air pollution. Wood-burning can sometimes cause higher levels, and industrial emissions can supply metallic particulate matter (NIPH report, 2013).
Particulate matter is present in different sizes:
- PM10
- PM2.5 (fine fraction)
- PM2.5-10(coarse fraction)
- PM 0.1 (ultrafine)
The annual mean levels of PM10 in several Norwegian towns and densely populated areas lie between 15 and 25 micrograms / m3 (Figure 1a and table 1), and for PM2.5, the levels lie between 6 and 15 micrograms / m3; see Figure 1b and table 1. These are below the limit values, but above the air quality criteria.
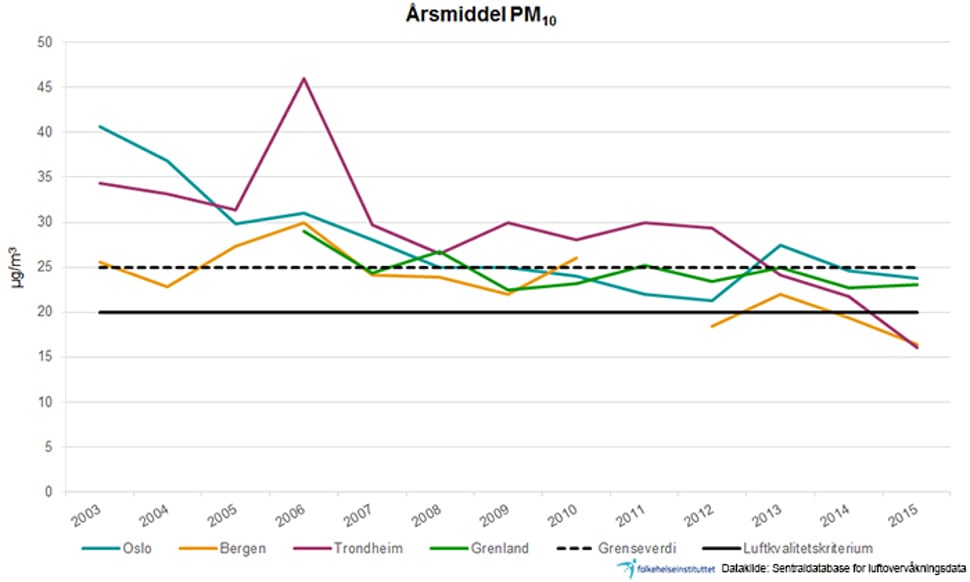
Figure 1A: Annual mean levels of particulate matter (PM10) in Oslo, Bergen, Trondheim and Grenland from 2003 to 2015. Figure also shows limit values (dotted black line) and air quality criteria (solid black line). Source: Central database for air monitoring data, Norwegian Environment Agency.
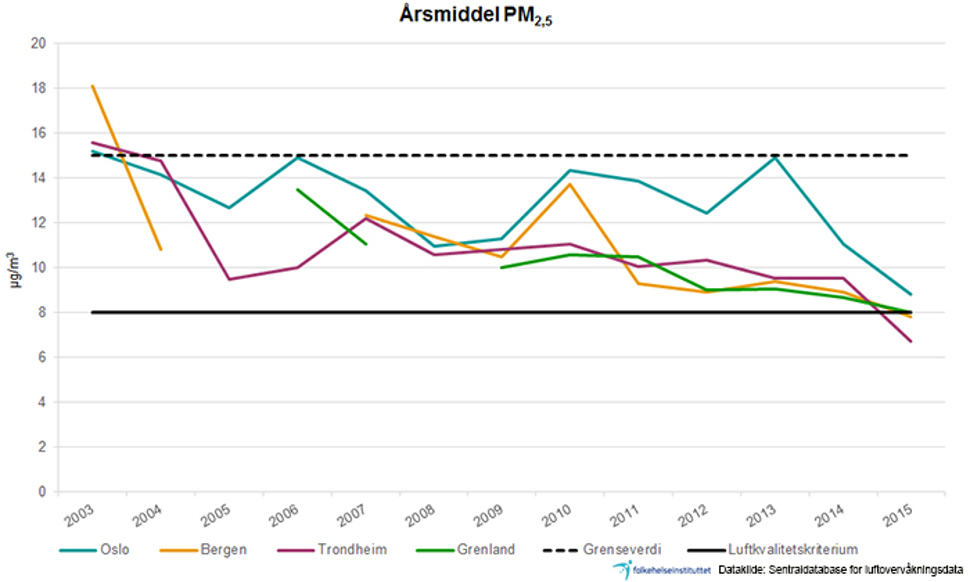
Figure 1B: Annual mean levels of particulate matter (PM2.5) in Oslo, Bergen, Trondheim and Grenland from 2003 to 2015. Figure also shows limit values (dotted black line) and air quality criteria (solid black line). Source: Central database for air monitoring data, Norwegian Environment Agency.
|
Annual mean levels of particulate matter |
||
|
PM10 |
PM2.5 |
|
|
Oslo |
24 |
9 |
|
Bergen |
16 |
8 |
|
Trondheim |
16 |
7 |
|
Tromsø |
18 |
6 |
|
Stavanger |
22 |
10 |
|
Drammen |
24 |
|
|
Lillehammer |
21 |
8 |
|
Grenland |
23 |
8 |
Nitrogen dioxide
The major source of NO2 is road traffic, and diesel cars in particular have high emissions. Levels of NO2 in ambient air vary greatly during the day, in different seasons and places (NIPH, 2013).
The mean levels in the largest towns lie above the limit values for the annual mean of 40 micrograms/m3 (see Figure 2A and table 2). Maximum hourly values may exceed the limit value of 200 micrograms / m3 (see Figure 2b and table 2) (limit values may be exceeded seven times per year).
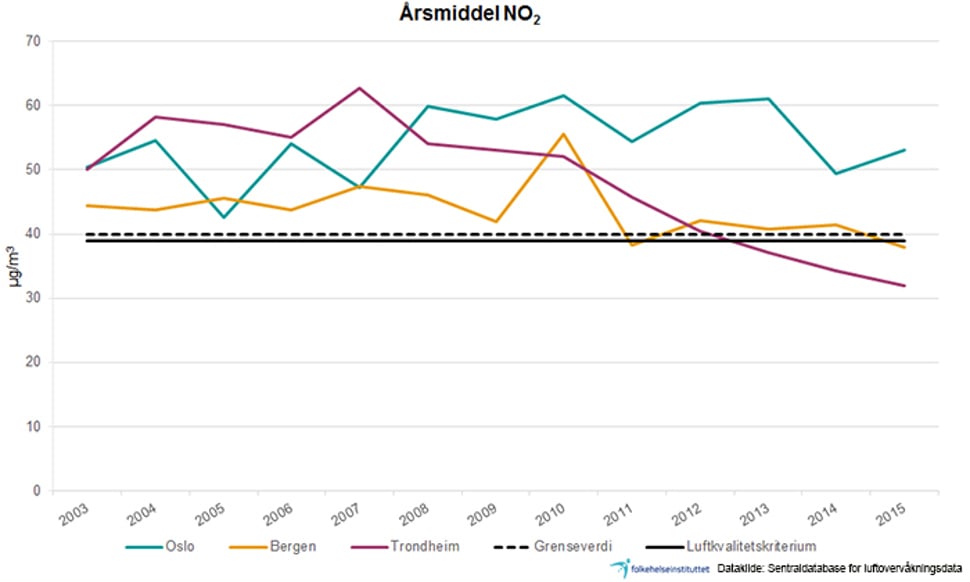
Figure 2A: Annual mean levels of nitrogen dioxide (NO2) in Oslo, Bergen and Trondheim in the period 2003 to 2015. Limit values (dotted black line) and air quality criteria (black line) run parallel. Source: Central database for air monitoring data, Norwegian Environment Agency.
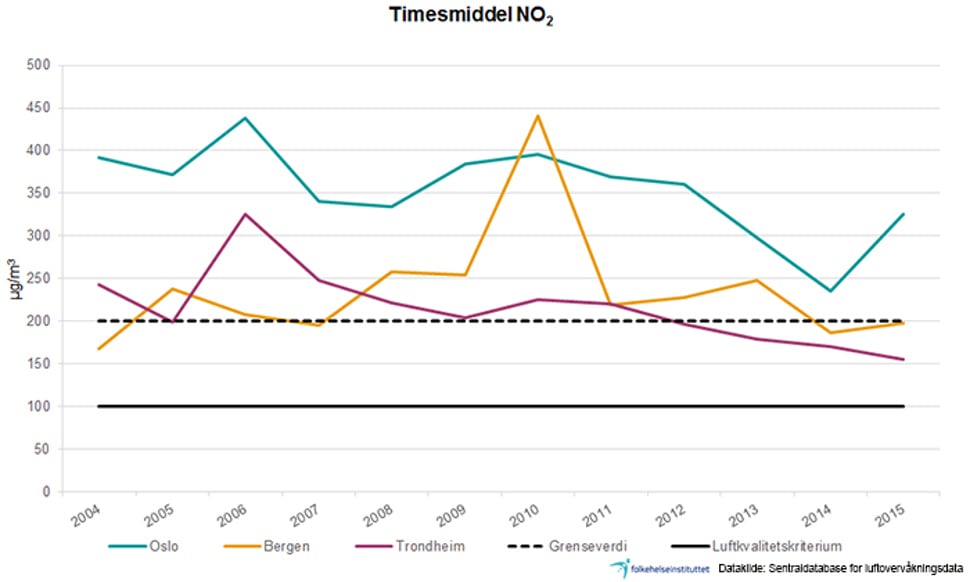
Figure 2B: Maximum hourly mean levels of nitrogen dioxide (NO2) in Oslo, Bergen and Trondheim in the period 2003 to 2015. Limit values (dotted black line) and air quality criteria (black line) are shown. Source: Central database for air monitoring data, Norwegian Environment Agency.
|
|
Annual mean NO2 |
Maximum hourly mean NO2 |
|
Oslo |
53 |
325 |
|
Bergen |
38 |
198 |
|
Trondheim |
32 |
156 |
|
Tromsø |
29 |
140 |
|
Stavanger |
34 |
168 |
|
Drammen |
36 |
175 |
|
Lillehammer |
33 |
150 |
Ozone
Ozone is produced when nitrogen oxides (NOx), volatile organic compounds (VOC) and sunlight are present. The amount of NO2 and volatile organic compounds will determine the ozone concentration. Direct release of ozone has little significance for ozone concentration in outdoor air.
Ozone that has moved in from the continent contributes most to the ozone levels in Norway. Local emissions contribute somewhat, but to a lesser degree.
Levels vary from season to season and from place to place, and are equally high in the countryside as in towns (NIPH, 2013).The ozone concentration in Norway has periodically reached levels close to 150 micrograms/m3 in recent years. According to the Pollution Regulations, the threshold for informing the public is 180 micrograms/ m3 (see Figure 3).
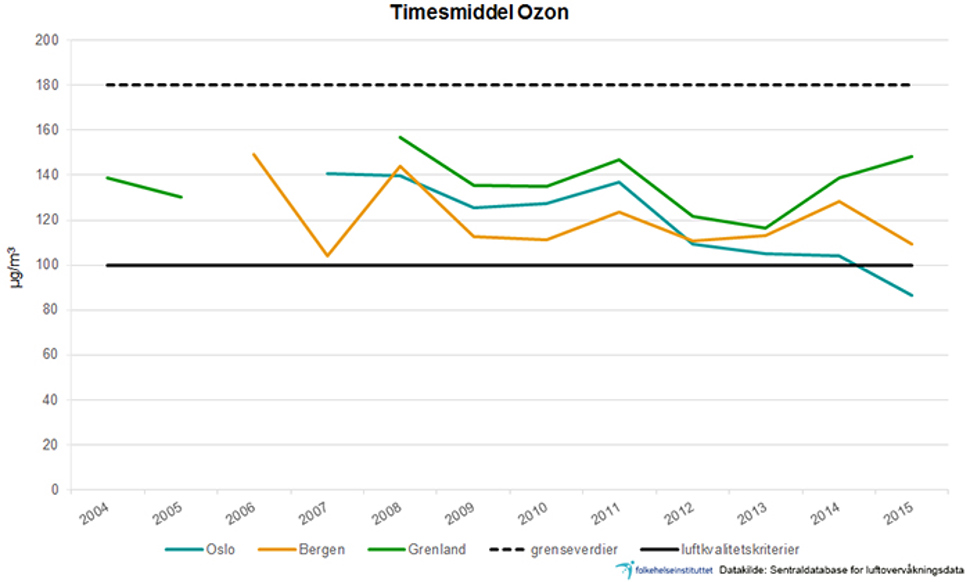
Figure 3: Maximum hourly mean concentration of ozone in Oslo, Bergen and Grenland from 2004 to 2015. The figure also shows the threshold for public information (black dotted line) and air quality criteria (black line). Source: Central database for air monitoring data, Norwegian Environment Agency.
Developments over time
- Particulate matter levels have declined during the last decade and are expected to decline in the years ahead, see Figures 1a and 1b. This is due to measures that have been implemented for vehicle emissions, studded tyre duty, increased dust binding and road cleaning (Norwegian Environmental Agency, 2014). See figure 4.
- The limit value for PM 10 per day was previously exceeded in several Norwegian towns and densely populated areas but the introduction of effective measures has led to most areas now lying under the respective limit values.
- Nitrogen dioxide levels have increased somewhat in Oslo in the last decade see Figure 2a. This may be due to more diesel cars on the roads. However, we see that the levels over the last two years have been reduced.
- Ozone levels have been relatively stable in recent decades and depend largely on continental emissions. However, over the last few hundred years the concentration of ground-level ozone has doubled.
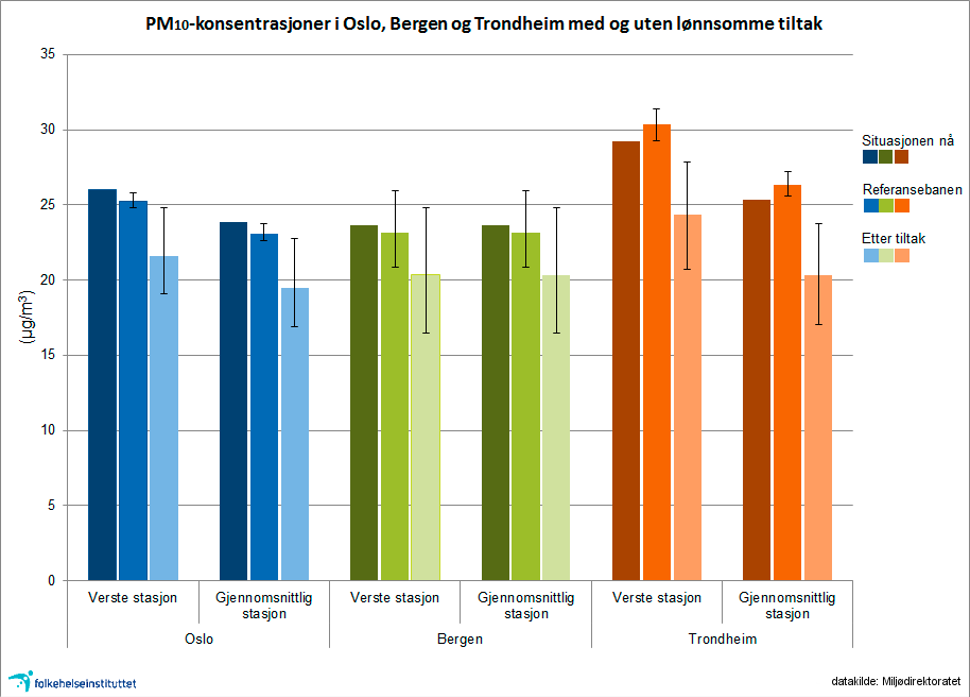
Figure 4: PM10 concentrations in Oslo, Bergen and Trondheim with and without beneficial measures. Source: Norwegian Environmental Agency, 2014.
Comments to figure 4:
To arrive at beneficial measures, cost-benefit analyses are carried out for a range of interventions. The figure shows:
- how we expect the concentration will develop from today’s level (darkest columns) until 2024 if new interventions are not introduced (reference path, lighter columns).
- how levels can be reduced even more if all the beneficial interventions are carried out (lightest columns).
Differences in the population
Geographical differences
Level of particulate matter and NO2 vary considerably between urban areas and elsewhere in the country. There may also be large variations within each town and densely populated area, depending on traffic and other emissions.
Ozone levels are distributed more evenly throughout the country.
International differences
Globally, air pollution (outdoor and indoor) is considered to be the most important environmental factor that causes health effects.
- WHO has estimated that approximately 4 million deaths could be attributed to outdoor air pollution in 2012, with about 0.5 million deaths in Europe (WHO, 2014).
- The international global burden of disease project (Forouzanfar, 2016) found that 4.2 million deaths worldwide could be due to outdoor air pollution.
In Norway, the levels in the biggest towns are similar to the other Scandinavian countries, but are lower than most of the other larger towns in Europe (Eeftens, 2012).
Air pollution and health risks
Outdoor air pollution can trigger and aggravate diseases that occur primarily in the respiratory and cardiovascular system (WHO, 2000; 2006). Health effects seem to occur at lower concentrations than previously expected (NIPH, 2013).
Exposed groups
- People with airway diseases (asthma, COPD, infections) and cardiovascular diseases are particularly vulnerable to the health effects of air pollution
- People with diabetes and obesity appear to be vulnerable to the undesirable effects of air pollution.
- Children with under-developed respiratory tracts are also vulnerable.
Low socioeconomic status also makes people vulnerable to the health effects of air pollution.
The Global Burden of Disease project estimates that every year, 1400 and 54 premature deaths in Norway can be attributed to fine fraction PM2.5 and ozone, respectively. In addition, it is estimated that PM2.5 is involved in almost 18 000 healthy life-years (DALY), where the majority are blamed for premature death (Forouzanfar, 2016).
Health risks of different particulate matter fractions
- Short-term exposure (hours or days) in polluted air can cause deterioration of respiratory diseases, e.g., asthmatics may experience more frequent or severe attacks Particulate matter can cause worsening of cardiovascular diseases.
- It is believed that asthmatic children are more prone to chronic obstructive pulmonary disease (COPD) in adulthood.
- Prolonged exposure (months-years) for air pollution also appears to contribute directly to diseases development. The risk of disease and death is higher with prolonged than with short-term exposure.
The health effects of particulate matter have been observed both in clinical studies and in population studies. It is well documented that PM2.5 and PM10 worsen respiratory and cardiovascular diseases. Both short term and prolonged exposure show associations with mortality and poor health. The risk of disease and death is higher during prolonged exposure than short-term exposure.
The Norwegian Institute of Public Health has estimated that annually, 185 and 115 deaths can be attributed to pollution from fine fraction PM2.5 and PM10. The total burden of disease (DALY) for Oslo is estimated to 2674 (NIPH, 2016). DALY includes premature death in addition to severe problems caused by particulate matter (PM2.5). Significant problems caused by particulate matter make up approximately a third. These estimates are based on more accurate exposure than that performed in the GBD data for Norway mentioned above (Forouzanfar, 2016).
Other particulate matter fractions than PM10 and PM2.5 are also associated with health effects:
- Coarse fractions (PM2.5-10) appear to be related to mortality and poor health after brief exposure.
- Data for PM0.1 (ultrafine particles) are insufficient to be able to comment about causal associations.
- When it comes to climate issues, there has been a lot of focus on black carbon particles. Risk estimates for these carbon particles concerning mortality and poor health are higher than for PM2.5 and PM10. This applies to both short term and prolonged exposure.
It is less clear which particulate sources contribute most to the observed health effects:
- Studies show that pollution from both traffic (exhaust gases and road dust) and wood-burning are significant.
- Metal that is bound to particulate matter can contribute to health effects.
- Organic compounds such as PAH bind to combustion particles and may contribute to the development of cancer. One of the components (benzo [a] pyrene - BaP) is used as a marker for the carcinogenic effects of PAHs.
Health risks of nitrogen dioxide (NO2)
Health effects are observed after brief exposure to NO2 in both clinical and population studies. The effects of prolonged exposure are only examined in population studies.
The most important health effects linked to short-term NO2 exposure are reduced lung function and exacerbation of asthma and bronchitis as well as higher mortality. Results from population studies have shown a higher morbidity and mortality from lung and cardiovascular problems with prolonged NO2 exposure, but it is very difficult to distinguish the effects of NO2 from the effects of particulate matter in these studies.
Health risks of ozone
High levels of ground-level ozone can be a health problem. Most of the ozone is absorbed in the upper respiratory tracts but it can reach deep into the airways, particularly during high physical activity (NIPH, 2013).
With short-term exposure to ozone, inflammation reactions, reduced lung function and increased respiratory symptoms are seen. Ozone can provide higher morbidity from respiratory diseases, while mortality is associated with both respiratory and cardiovascular diseases.
There are large individual differences in each individual's sensitivity to the health
Several components act together
Many air polluting components trigger the same health effects and combine effects. Since people are subjected to a range of different components simultaneously, health effects that are observed are a result of the total exposure to air pollution. This may be why health effects are observed at lower levels in population studies than in many experimental studies. However, little is known about these interactions and mechanisms, particularly at low concentrations.
Preventive measures against air pollution
New knowledge about the health effects of particulate matter means that the NIPH and Norwegian Environmental Agency have set stricter criteria for air quality with respect to PM10 and PM2.5. To date, we do not know enough to be able to set air quality criteria for other sized fractions. Also for nitrogen dioxide, the air quality criteria have recently been revised. These criteria are established, so that the majority of the population is protected against harmful effects if they are exceeded.
To reduce particulate matter and nitrogen dioxide further in outdoor air, measures against road traffic, particulate matter, wood-burning and industrial emissions must be extended.
Reducing ozone levels requires stricter international agreements to reduce emissions of volatile organic compounds and nitrous oxides.
It is assumed that new proposals to limit values and the use of health-based national targets (Norwegian Environmental Agency, 2014) and air quality criteria (NIPH, 2013) in planning will contribute to reduced exposure. Air pollution will therefore have fewer harmful effects.
Intensified measures against air pollution by particulate matter from roads, car exhausts and exchange old with new heaters are planned (Norwegian Environmental Agency, 2014). We expect this to reduce levels. There is some uncertainty tied to how much the measures will reduce the incidence of the smallest particles. Follow-up of the Gothenburg Protocol and Parma Declaration on Environment and Health can give us better air quality and lower exposure to hazardous substances.
