Daily report and statistics about coronavirus and COVID-19
Article
|Updated
Here is a selection of key data and statistics about SARS-CoV-2 and COVID-19 disease in Norway.
Key figures for Norway
Total number in Norway since February 2020 (cumulative figures):
Number of tests
The figure below illustrates the number of persons tested and the test results since the start of the epidemic. Since March 2020, all laboratory results are collected in the MSIS Laboratory Database. Each laboratory in Norway submits data electronically directly to the database both on the number and result of each test and on the persons tested.
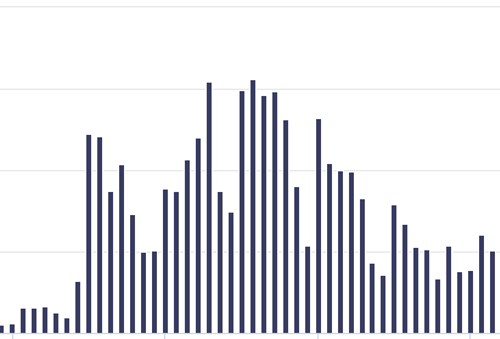
Reported cases
The figure below shows the number of cases reported daily in Norway since the start of the epidemic. The cases are displayed by the specimen collection date. There are 1-2 days delay between diagnosis and registration in the Norwegian Surveillance System for Communicable Diseases (MSIS). The number of cases is updated retroactively when new notifications arrive.
By sex and age
The figure below shows the total number of confirmed cases in Norway since the epidemic began, by age and sex.
By county
The maps below illustrate the number of reported COVID-19 cases by county and the reported rate by 100 000 inhabitants.
By municipality
The map shows the number of reported COVID-19 cases by municipality.
The figure is updated with the number reported by midnight on the previous day. Cases in MSIS are registered geographically and are based on the address in the population register. Therefore, there may be more cases reported in a municipality in MSIS than the municipality is aware of. MSIS also receives notifications that are not sent to the Municipal Medical Officer.
If you cannot find a municipality in the list, it means that MSIS has not yet received any notifications about people registered in that municipality.
Hospital admissions
The figure below illustrates the number of new patients admitted to hospital with COVID-19 as the main reason for admission.
Intensive care admissions
The figure below illustrates the number of patients with laboratory-confirmed COVID-19 admitted to intensive care.
COVID-19-associated deaths, by age and sex
The figure below illustrates the number of COVID-19 associated deaths notified to the Norwegian Institute of Public Health, divided by sex and age group.
Reports
Daily and weekly reports (in Norwegian)
- 2020.06.11 - Daily report Norway COVID-19.pdf
- 2020.06.11 - Nordic countries and the world COVID-19.pdf
- Older daily reports
- COVID-19 weekly reports
Other COVID-19 statistics
Reproduction number - R
The reproduction number R will be presented weekly in the weekly report (Norwegian).
Inpatients in hospital
- COVID-19 - number of patients admitted to hospital (Directorate of Health)
Total mortality
The NIPH also calculates the total mortality in Norway through the NorMOMO-system. The status for total mortality is mentioned in the weekly reports.